
Zalando Postgresql operator
Kubernetes is a very powerful tool to manage containerized applications. You can manage containers with « pod » resource, lifecycle with « deployment » resource, network with « service » and « ingress » resources, etc..
And if you want, you can extends the list of resources that kubernetes can handle with custom resources definitions. Then those CRDs will be managed by an operator which run inside your cluster.
For example, you can manage postgresql database resources with the zalando-postgresql-operator !
This is a very cool operator. It is powered by Patroni (also from zalando), a tool to high available Postgresql instances with auto failover and replication between instances.
Installation
You can use kustomize to deploy this operator. Create a file postgres-operator/kustomize.yml with the content :
apiVersion: kustomize.config.k8s.io/v1beta1
kind: Kustomization
resources:
  - https://raw.githubusercontent.com/zalando/postgres-operator/v1.8.2/manifests/configmap.yaml
  - https://raw.githubusercontent.com/zalando/postgres-operator/v1.8.2/manifests/operator-service-account-rbac.yaml
  - https://raw.githubusercontent.com/zalando/postgres-operator/v1.8.2/manifests/postgres-operator.yaml
  - https://raw.githubusercontent.com/zalando/postgres-operator/v1.8.2/manifests/api-service.yaml
Then apply it to your cluster wth kubectl
kubectl apply -k postgres-operatorConfiguration
Now we have a Postgresql operator deployed in our Kubernetes cluster, we can manage Postgresql instances.
The zalando team provide a full example of Postgresql manifests. Here is a simple example to have a postgresql primary + replica instance with a telegraf sidecar for the monitoring :
apiVersion: "acid.zalan.do/v1"
kind: postgresql
metadata:
  name: aperogeek
  namespace: database
spec:
  teamId: "aperogeek"
  volume:
    size: 100Gi
  numberOfInstances: 2
  users:
    beer:  # database owner
    - superuser
    - createdb
    telegraf: []
    kafkaconnect:
    - superuser
    - replication
  databases:
    aperogeek: beer  # dbname: owner
  postgresql:
    version: "14"
    parameters:
      wal_level: logical
  additionalVolumes:
   - name: telegraf-config
     mountPath: /etc/telegraf
     targetContainers:
       - telegraf
     volumeSource:
       configMap:
         name: telegraf-config
  spiloFSGroup: 103
  sidecars:
    - name: "telegraf"
      image: "telegraf:latest"
      resources:
        limits:
          cpu: 500m
          memory: 500Mi
        requests:
          cpu: 10m
          memory: 64Mi
      ports:
        - containerPort: 9273
          protocol: TCP
      env:
      - name: DATABASE_NAME
        value: aperogeek
      - name: "TELEGRAF_PASSWORD"
        valueFrom:
          secretKeyRef:
            key: password
            name: telegraf.aperogeek.credentials.postgresql.acid.zalan.do
With this manifest, I tell the postgres operator to create a 2 instance cluster (1 primary and 1 standby). The operator will manage the replication between the 2 instances and the failover if the primary pod restart.
The operator will also manager postgres user and database for me. Each user will have a kubernetes secret with the name {username}.{clustername}.credentials.postgresql.acid.zalan.do.
So you can directly tell your application to use this secret to connect to postgresql without exporting it to external secret manager. (You can also create secrets in different namespaces).
Zalando operator can also prepare database for you with existing schema and pre-installed extensions.
One other cool stuff of the zalando postgres operator is the backup and restore feature.
You can tell Spilo (the postgresql + Patroni docker bundle) to continuously stream you wall file to a remote S3 compatible storage and periodically take a physical base backup of your database.
This way you can have a high available postgresql instance with Point In Time recovery 🎉
Monitoring
I’ve also added a sidecar container with telegraf image which is used to expose postgresql metrics on /metrics with the prometheus format.
I’ve also configured an additional volume to mount the telegraf config in the telegraf sidecar container. (thanks to my previous MR 😜)
Here is my telegraf config file :
[global_tags]

[agent]
  interval = "10s"
  round_interval = true
  metric_batch_size = 1000
  metric_buffer_limit = 10000
  collection_jitter = "0s"
  flush_interval = "10s"
  flush_jitter = "0s"
  logtarget = "stderr"
  omit_hostname = false

[[outputs.prometheus_client]]
  listen = ":9273"
  namedrop = ["tail"]

[[outputs.file]]
  namepass = ["tail"]
  files = ["stdout"]
  data_format = "json"

[[inputs.disk]]
  ignore_fs = ["tmpfs", "devtmpfs", "devfs", "iso9660", "overlay", "aufs", "squashfs"]
[[inputs.diskio]]

[[inputs.postgresql_extensible]]
  address = "host=127.0.0.1 user=telegraf dbname=$DATABASE_NAME sslmode=require password=$TELEGRAF_PASSWORD"
  databases = ["$DATABASE_NAME"]
  [[inputs.postgresql_extensible.query]]
    sqlquery="SELECT * FROM pg_stat_database where datname"
    version=110
    withdbname=true
    tagvalue=""
  [[inputs.postgresql_extensible.query]]
    sqlquery="SELECT * FROM pg_stat_bgwriter"
    version=1100
    withdbname=false
    tagvalue=""
  [[inputs.postgresql_extensible.query]]
    sqlquery="SELECT usename, count(*) as nb_connections FROM pg_stat_activity GROUP BY usename"
    version=1100
    withdbname=false
    tagvalue="usename"
  [[inputs.postgresql_extensible.query]]
    sqlquery="select setting as max_connections from pg_settings where name='max_connections'"
    version=1100
    withdbname=false
    tagvalue=""
  [[inputs.postgresql_extensible.query]]
    sqlquery="select setting as shared_buffers from pg_settings where name='shared_buffers'"
    version=1100
    withdbname=false
    tagvalue=""
  [[inputs.postgresql_extensible.query]]
    sqlquery="SELECT pg_database_size('$DATABASE_NAME') as db_size"
    version=1100
    withdbname=false
    tagvalue=""
  [[inputs.postgresql_extensible.query]]
    sqlquery="SELECT t.tablename, pg_total_relation_size('\"' || t.schemaname || '\".\"' || t.tablename || '\"') AS table_total_disc_size FROM pg_tables t WHERE t.schemaname = 'public' ORDER BY pg_total_relation_size('\"' || t.schemaname || '\".\"' || t.tablename || '\"') DESC LIMIT 10"
    version=1100
    withdbname=false
    tagvalue="tablename"
  [[inputs.postgresql_extensible.query]]
    sqlquery="SELECT CASE WHEN pg_last_wal_receive_lsn() = pg_last_wal_replay_lsn() THEN 0 ELSE EXTRACT (EPOCH FROM now() - pg_last_xact_replay_timestamp()) END AS replication_lag"
    version=1100
    withdbname=false
    tagvalue=""

[[inputs.tail]]
  files = ["/home/postgres/pgdata/pgroot/pg_log/*.csv"]
  from_beginning = false
  data_format = "csv"
  csv_column_names = ["log_time", "user_name", "database_name", "process_id", "connection_from", "session_id", "session_line_num", "command_tag", "session_start_time", "virtual_transaction_id", "transaction_id", "error_severity", "sql_state_code", "message", "detail", "hint", "internal_query", "internal_query_pos", "context", "query", "query_pos", "location", "application_name"]
This config is stored in a telegraf-config configMap in the same namespace as my database.
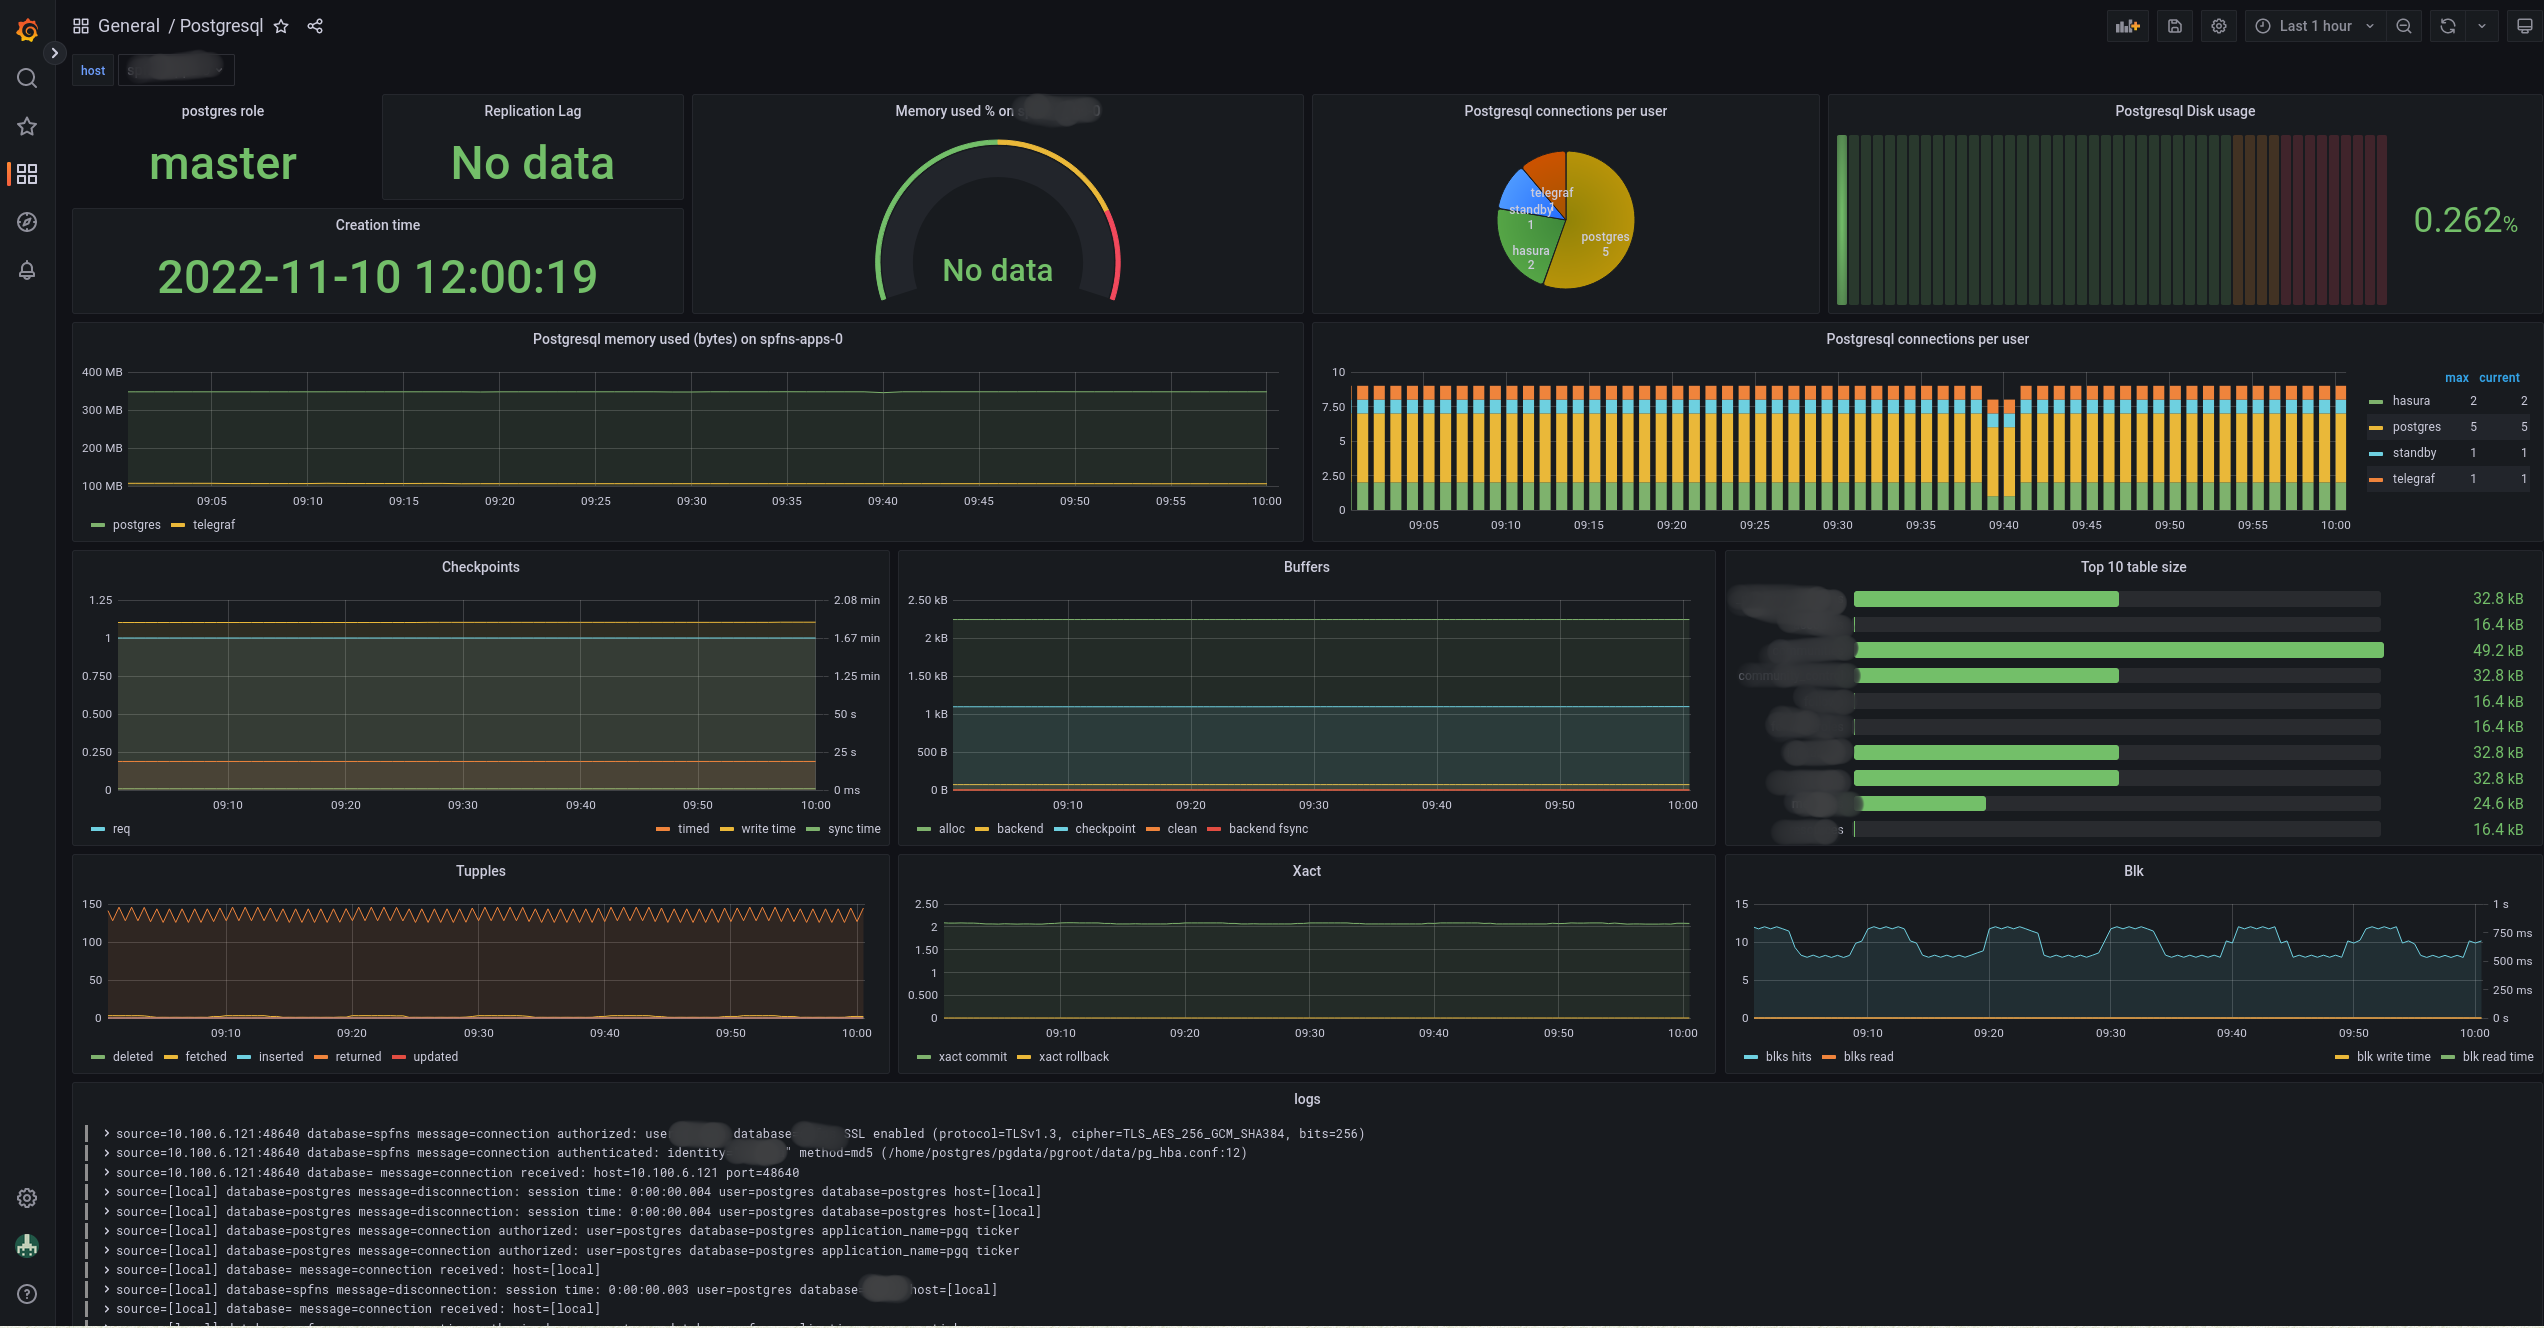
Then I can tell prometheus to scrape this endpoint and visualize metrics in grafana.
Conclusion :
I love this Kubernetes operator. It can handle all the features I need like :
- high availability (automatic failover and replication)
- pod anti-affinity
- node affinity
- backups and restore
- users and database management
- TLS
- monitoring with sidecar and Prometheus
Plus the dev team is really reactive. When I’ve submitted a merge request to add additional volume mount capabilities they responded very quickly and helped me a lot to make this feature work.
I didn’t tried other Postgresql operators for example
Both looks cool, but I didn’t found them at the time I was looking for deploying Postgresql into Kubernetes.
The negative point I can make on this operator are :
- Everything is managed in only one manifest and it can be unreadable.
Split configuration into separate manifest for database and roles can be a good idea. - The monitoring is not included by default. You have to configure an external tool to monitor your database