A small post to talk about telegraf and influxdb (aka Tick Stack, without Chronograf and Kapacitor)
Telegraf

Telegraf is a metrics collect tool written in Go which can collect system metrics like cpu, memory disk, and also application metrics (apache, nginx, elasticsearch, jmx, etc..)
Telegraf collect metrics from « input » plugins, parse it to the correct format (influxdb line protocol / json) then send it to « output » plugins. There is a lot of input and output plugins, you just have to activate them in the telegraf config file.
Here I’m using the Docker input plugin to fetch all the stats from my docker daemon (number of running containers, cpu / memory usage per container, etc..)
Here is the configuration for the docker input plugin :
# # Read metrics about docker containers
[[inputs.docker]]
  ## Docker Endpoint
  ## To use TCP, set endpoint = "tcp://[ip]:[port]"
  ## To use environment variables (ie, docker-machine), set endpoint = "ENV"
  endpoint = "unix:///var/run/docker.sock"
  ## Only collect metrics for these containers, collect all if empty
  container_names = []
  ## Timeout for docker list, info, and stats commands
  timeout = "5s"
  ## Whether to report for each container per-device blkio (8:0, 8:1...) and
  ## network (eth0, eth1, ...) stats or not perdevice = true
  ## Whether to report for each container total blkio and network stats or not
  total = false
InfluxDB
 Next I tell telegraf to send all my metrics to InfluxDB, a time series database :
# Configuration for influxdb server to send metrics to
[[outputs.influxdb]]
 ## The full HTTP or UDP endpoint URL for your InfluxDB instance.
 ## Multiple urls can be specified as part of the same cluster,
 ## this means that only ONE of the urls will be written to each interval.
 # urls = ["udp://localhost:8089"] # UDP endpoint example
 urls = ["http://influxdb:8086"] # required
 ## The target database for metrics (telegraf will create it if not exists).
 database = "telegraf" # required
 ## Retention policy to write to. Empty string writes to the default rp.
 retention_policy = ""
 ## Write consistency (clusters only), can be: "any", "one", "quorum", "all"
 write_consistency = "any"
 ## Write timeout (for the InfluxDB client), formatted as a string.
 ## If not provided, will default to 5s. 0s means no timeout (not recommended).
 timeout = "5s"
 # username = "telegraf"
 # password = "metricsmetricsmetricsmetrics"
 ## Set the user agent for HTTP POSTs (can be useful for log differentiation)
 # user_agent = "telegraf"
 ## Set UDP payload size, defaults to InfluxDB UDP Client default (512 bytes)
 # udp_payload = 512
Docker compose
 To start all of theses services I’m using docker-compose. I’ve just updated my docker-compose.yml file to add the following lines :
version: '2'
services:
[...]
  telegraf:
    image: telegraf
    hostname: telegraf
    container_name: telegraf
    volumes:
      - /var/run/docker.sock:/var/run/docker.sock
      - /data/telegraf/telegraf.conf:/etc/telegraf/telegraf.conf
    labels:
      - "traefik.enable=false"

  influxdb:
    image: influxdb
    hostname: influxdb
    container_name: influxdb
    volumes:
      - /data/influxdb:/var/lib/influxdb
    labels:
      - "traefik.enable=false"

  grafana:
    hostname: grafana
    container_name: grafana
    image: grafana/grafana
    expose:
      - 3000
    volumes:
      - /data/grafana:/var/lib/grafana
I reload my compose file with the command :
docker-compose up -d
Grafana

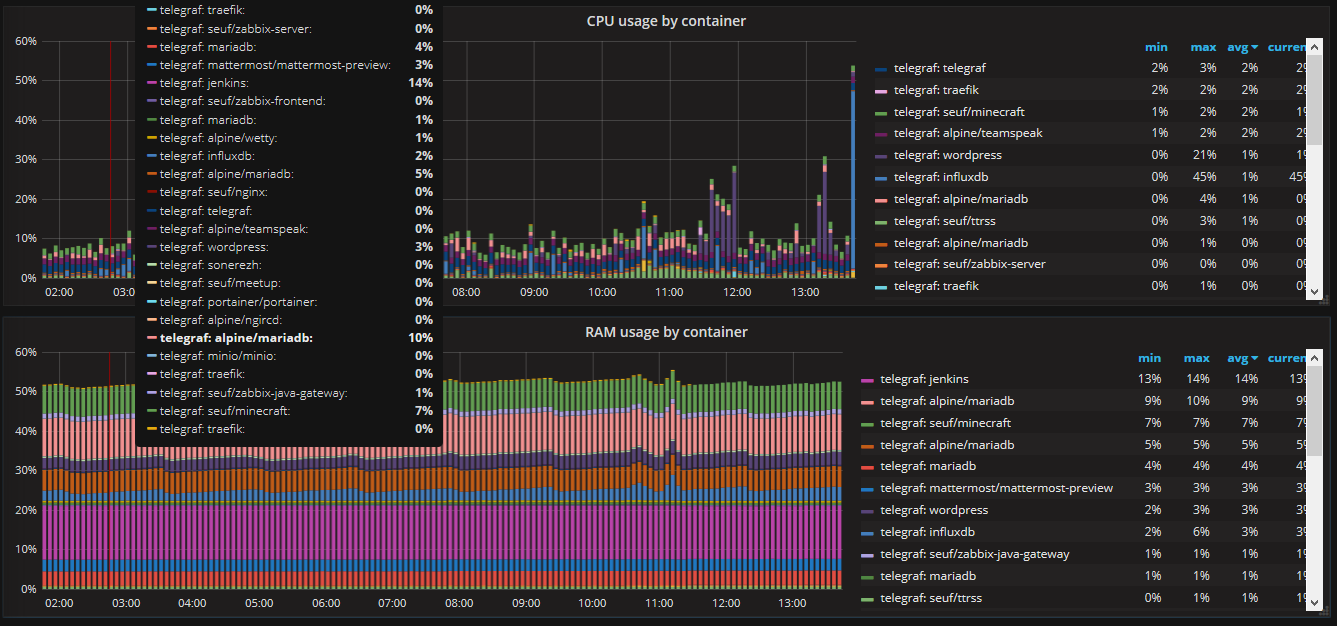
Now, with my docker metrics stored into InfluxDB, I can create dashboards into grafana.
First create an influxdb datasource pointing to the influxdb container (http://influxdb:8086)
Then import some dashboards available from the grafana catalog.
Here is a screenshot of the result.


Hi,
I am doing the same work as this page, after setting up telegraf, influxdb, docker-compose etc, I am having trouble to show the tables on grafana page, could you share more points about:
1) which dashboard are you using from the grafana website?
2) how did you config the data sheets / tables on the dashboard? I try to use below one:
https://grafana.com/grafana/dashboards/3056
but the container names are not shown.
Hello, The dashboard you imported is very old. I suggest you find a more recent one (https://grafana.com/grafana/dashboards?collector=Telegraf&dataSource=influxdb&search=docker&orderBy=updatedAt&direction=desc) or create your own.
You can also edit the panel and change the tag to use..