Prometheus Alertmanager Grafana annotation
At work, I’ve deployed a Prometheus Stack to monitor our Kubernetes pods and nodes.
Apps are exposing metrics on their /prometheus/metrics endpoint, then metrics are collected by Prometheus and stored into Prometheus + Thanos. Finally, we can use Grafana Prometheus data-source to create dashboards to see those metrics.
Here is a schema of the architecture I’ve set up to have a highly available Prometheus and long term storage back-end with Thanos and Google Cloud Storage :
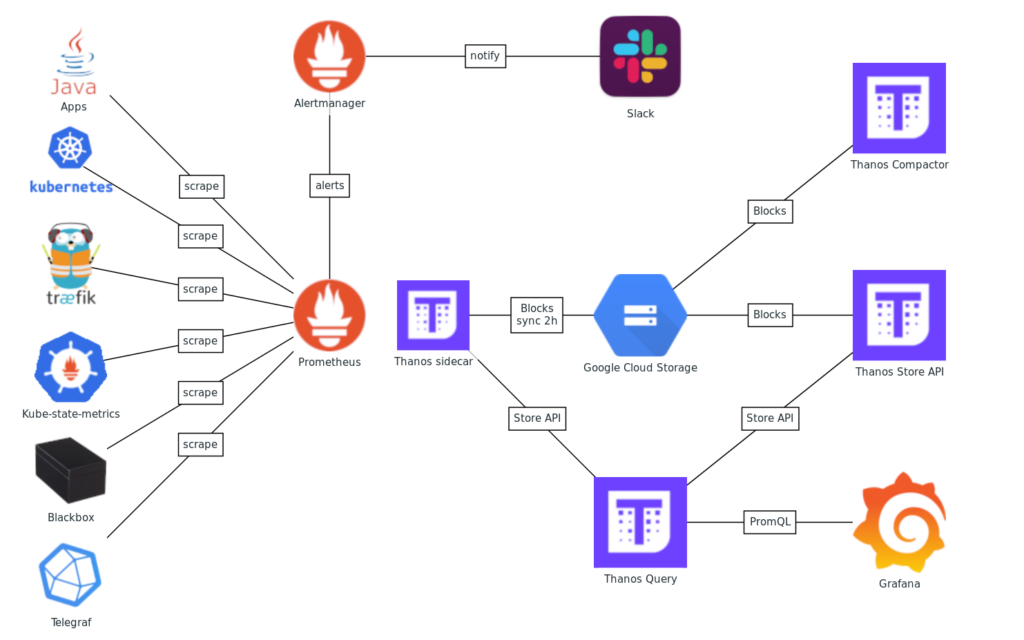
As you can see, when Prometheus Fire an alert, it sends an event to Alertmanager which in return de duplicate and dispatch the event to the configured media (Slack in this case).
Prometheus also create a metric for each fired alerts. It’s then possible to query this Prometheus ALERTS metrics to create annotation on Grafana dashboards and see what’s happened.
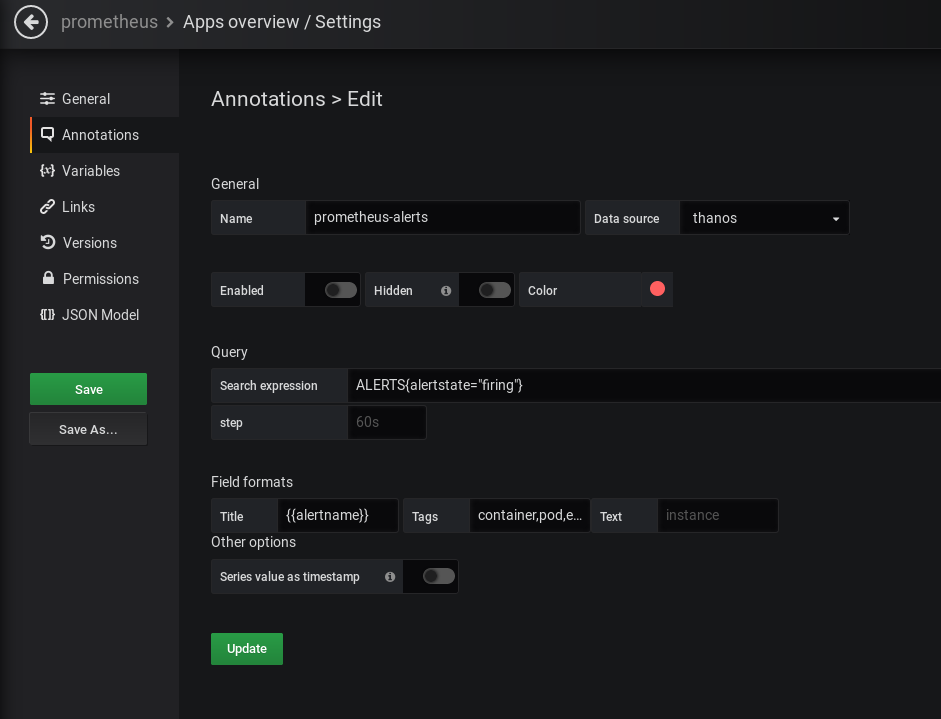
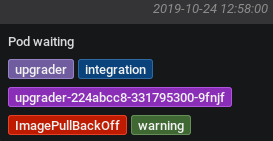
Unfortunately the annotations created are not well formatted. You can see only label values, and not label names. So it’s difficult to filter on labels and you have all irrelevant alerts showed on a dashboard not concerning the application you wan to watch.
So, the Idea is to user Alertmanager web-hook receiver to receive alerts from Alertmanager and create a Grafana annotation on the dashboard we want with the labels and messages we want !
The project is open sourced on our Malt public repo here :
https://gitlab.com/maltcommunity/public/prom2grafana
First, we need to deploy the prom2grafana docker image in our Kubernetes cluster. The pod is deployed with a configmap mounted inside containing a config.json with the Grafana url and credentials :
{
  "grafana_url": "http://grafana.monitoring.svc",
  "grafana_api_key": "abcdefghijklmnopqr"
}
Then with have to configure Alertmanager to dispatch received alerts from Prometheus to prom2grafana web-hook :
  routes:
    - receiver: "prom2grafana"
      group_wait: 10s
      match:
        grafana_dashboard: '.*'
      continue: true

  receivers:
    - name: "prom2grafana"
      webhook_config:
        send_resolved: false
        url: http://prom2grafana.monitoring.svc:8080
Now we can add a label on our Prometheus alert rules to specify on which Grafana dashboard we want to create an annotation. Here is an example of Prometheus rule with a grafana_dashboard annotation :
  - alert: Replicas Unavailable
    expr: kube_deployment_status_replicas_unavailable > 0
    for: 30m
    labels:
      severity: warning
      grafana_dashboard: "Apps%20overview"
    annotations:
      summary: "Pods unavailable in deployment {{ $labels.deployment }} for more than 30m"
      description: "Env: `{{ $externalLabels.env }}`\tNamespace: `{{ $labels.namespace }}`\tDeployment: `{{ $labels.deployment }}`"
To add Grafana annotations on your dashboard, go to your dashboard settings > annotations and add a new source of annotation like this :
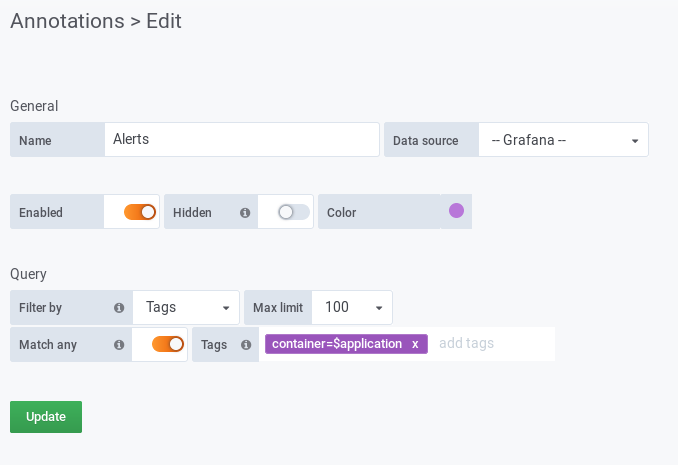
Et Voila !
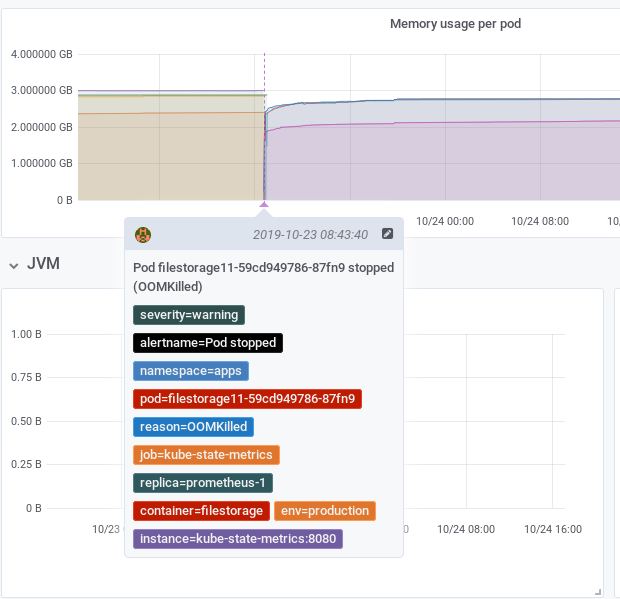
Now we have a clear Grafana annotation with all the label name and values. Also, only annotations with label container=$application are showed on my dashboard.