Kapacitor : Alerting for your timeseries
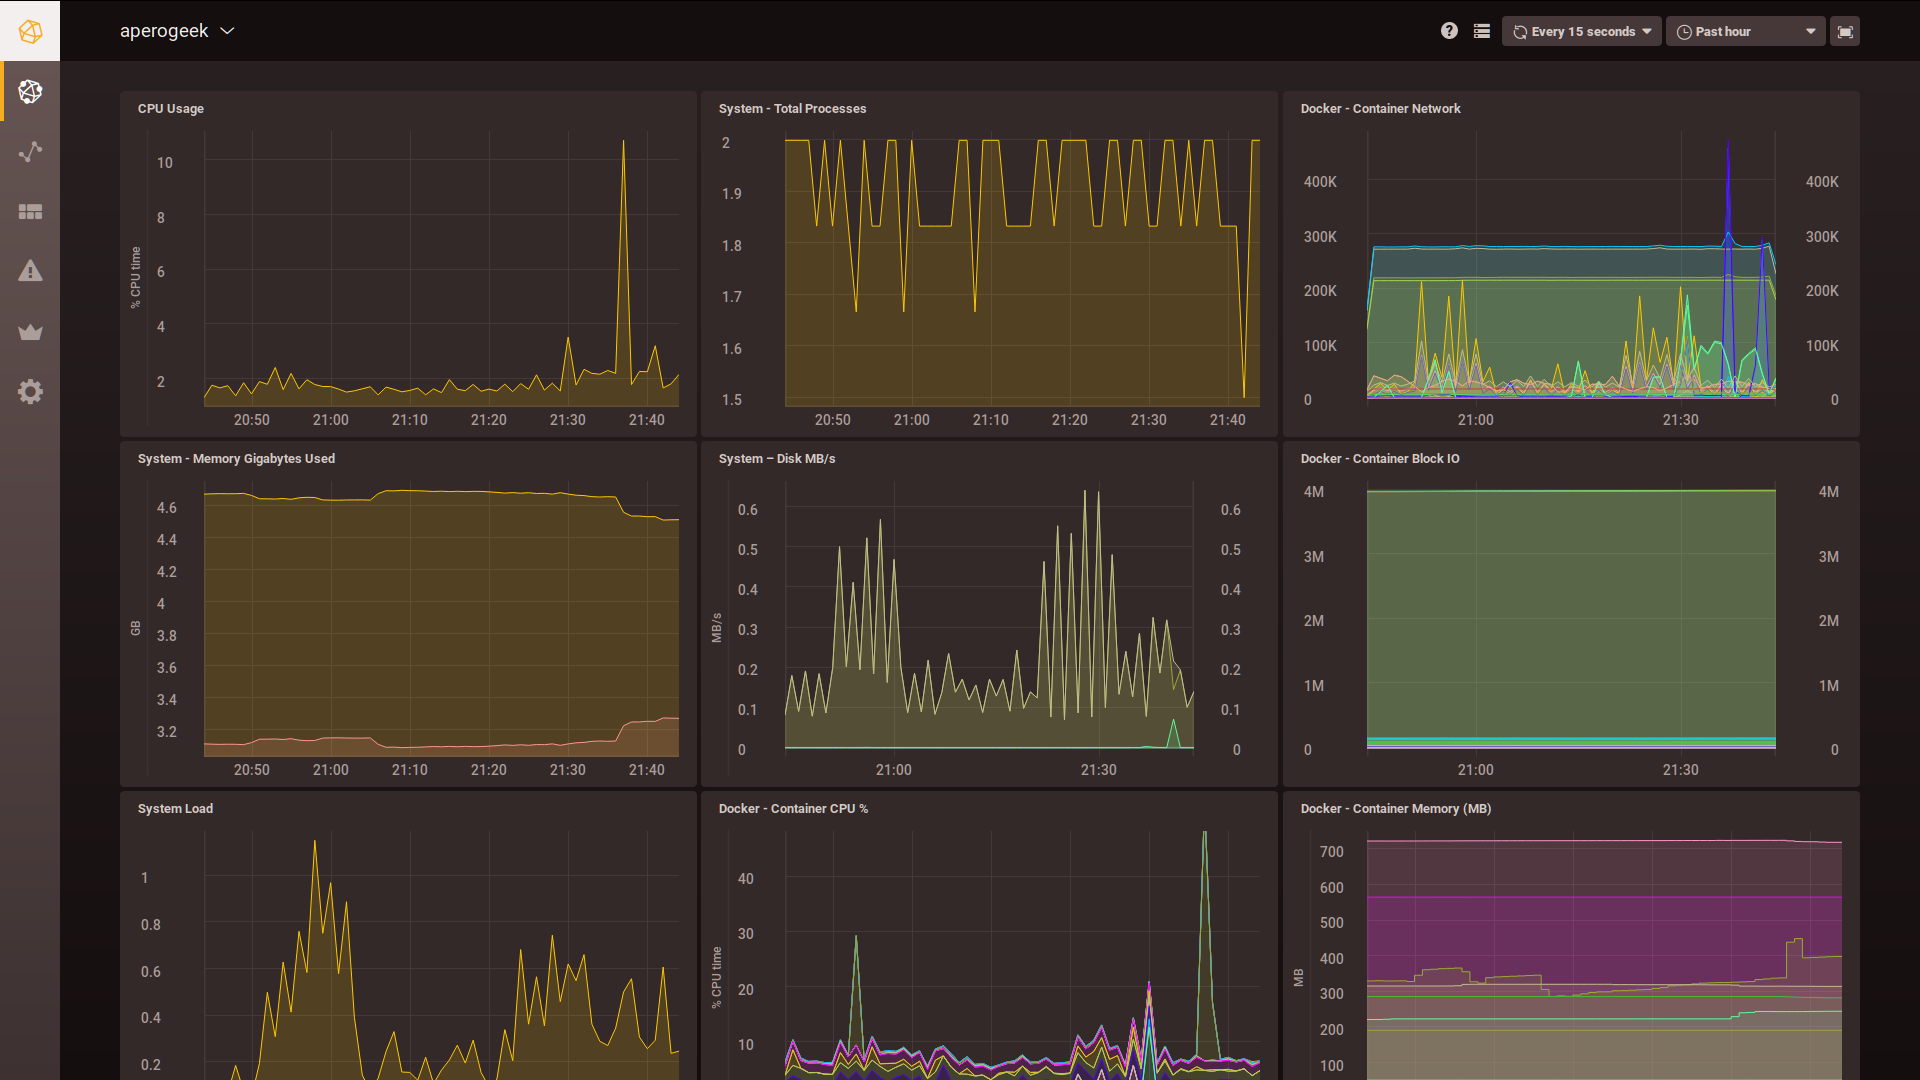
I already talk about monitoring docker with Telegraf, InfluxDB and Grafana. It’s nice, we have pretty dashboards, but it doesn’t do alerting ! Unless you sit in front of your screen all the day, you will not be warned when a container is crashing or when a friend connect on your Teamspeak channel !
![]()
Fortunaletly, in the TICK Stack of Influxdata, there is the « K » of Kapacitor.
Kapacitor is an Open source framework for processing, monitoring, and alerting on time series data.
To do that, Kapacitor use TickScripts, small scripts written in a custom DSL Langage, very simple to understand and deploy.
For exmple, if you want to send a warning level alert on your Slack Channel, when the CPU usage of one of your servers is greater than 70%, and a critical level alert when above 85% :
stream
    |from()
        .measurement('cpu_usage_idle')
        .groupBy('host')
    |window()
        .period(1m)
        .every(1m)
    |mean('value')
    |eval(lambda: 100.0 - "mean")
        .as('used')
    |alert()
        .message('{{ .Level}}: {{ .Name }}/{{ index .Tags "host" }} has high cpu usage: {{ index .Fields "used" }}')
        .warn(lambda: "used" > 70.0)
        .crit(lambda: "used" > 85.0)

        // Slack
        .slack()
        .channel('#alerts')
With this kind of DSL langage, we can create any rule we want. By requesting InfluxDB with InfluxQL queries then aggregating metrics by host or any tag, adding a filter based on any criteria (between 8am. and 7pm. from monday to friday for example), etc..
When the alert rule is ready, Kapacitor can use any alerting system, like :
- sending an email,
- post to slack or mattermost,
- write in a log file,
- send a pager duty message,
- upscale or downscale a docker swarm/kubernetes stack
- or simply execute a custom bash script.
Here is an example of alert generated by Kapacitor in Slack :

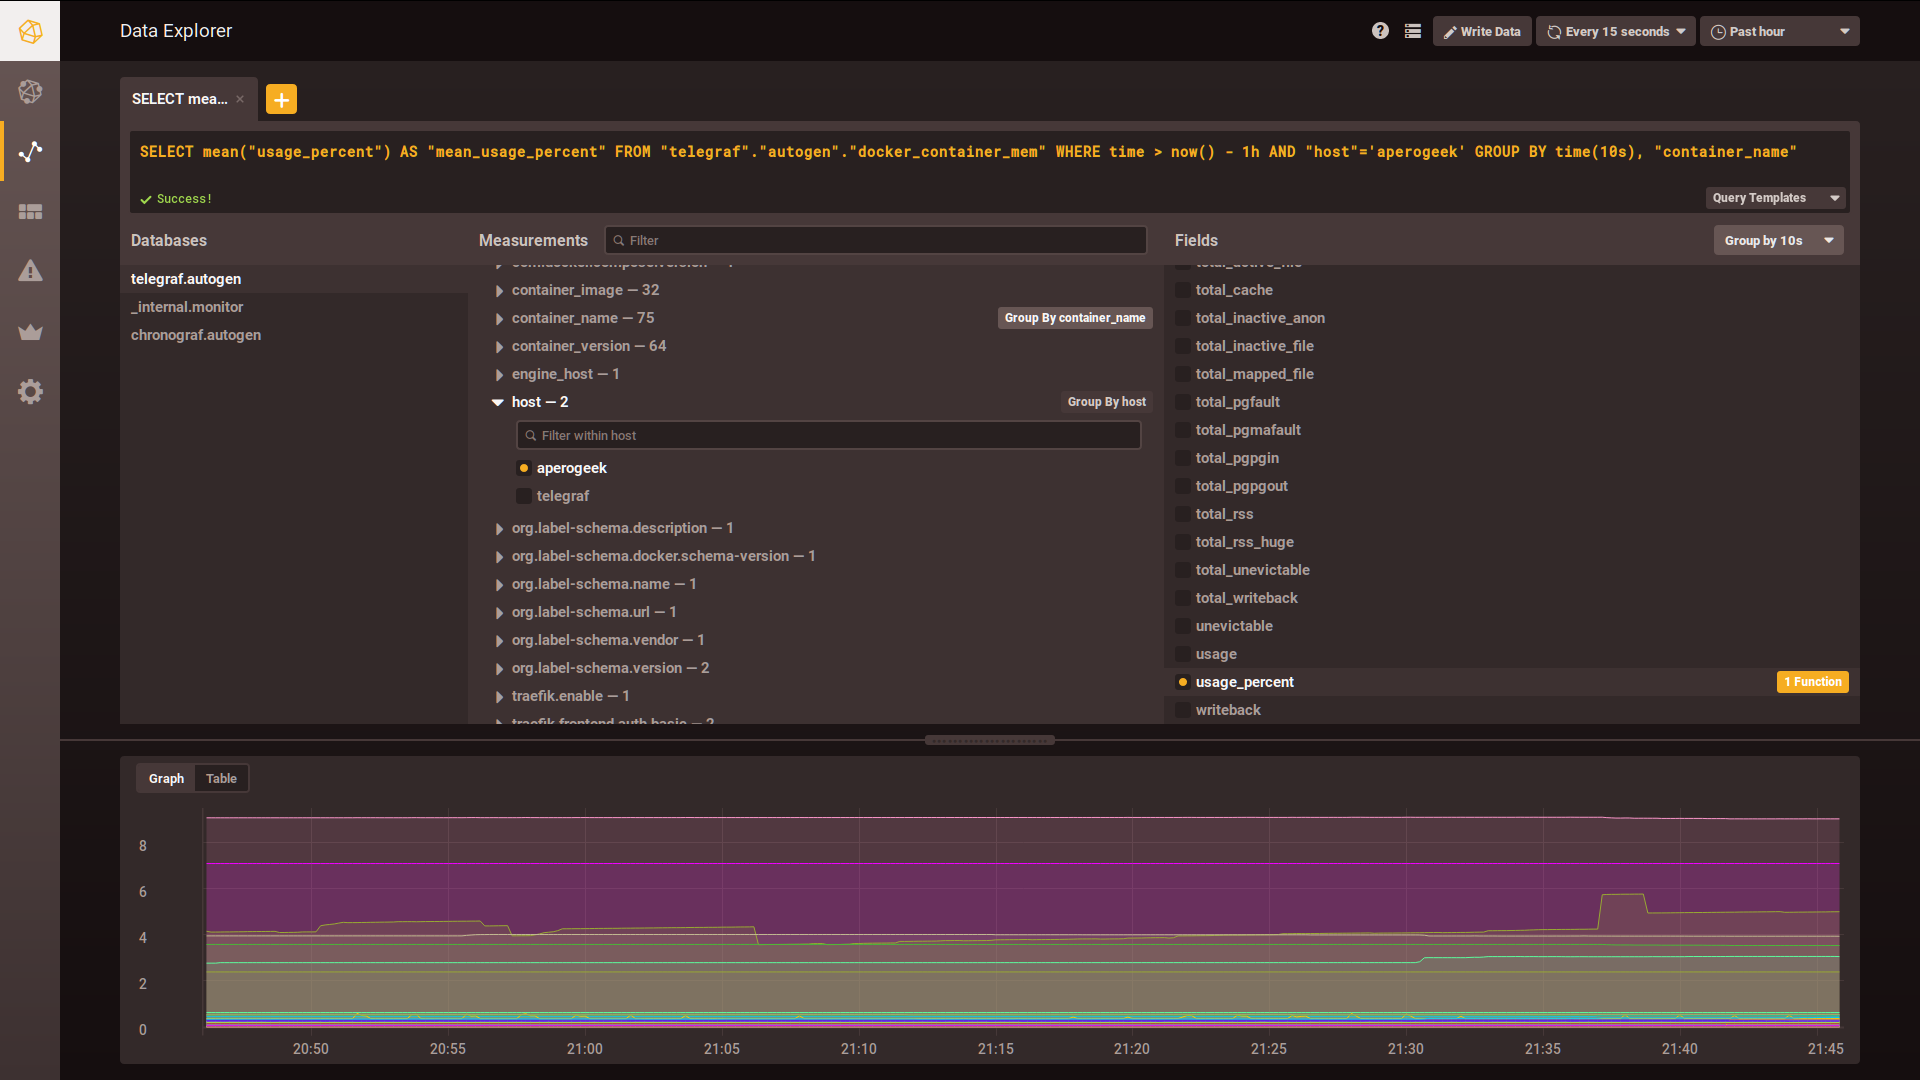
And for thoses who doesn’t want to get their hands dirty, there is Chronograf (the « C » in TICK Stack).
Chronograf is an open-source web application written in Go and React.js designed to visualize your monitoring data from influxDB.
We are far from a Grafana in term of features (and community), but it’s getting better every day. It allow you to explore your data very efficiently :
My favorite feature is the web based interface to easily create alerting and automation rules for Kapacitor. Of course the web interface limits you in term of Kapacitor DSL langage (an expert mode is on the way), but you can easily, in 3 clics, create simple rules like a threshold, detect a delta during a time period or even send a alert when there is no data (deadman) !
So, theses tools are pretty youngs, but are very interestings : I’ll keep a watch on it !